Basic Pandas Features for Network Engineers


Pandas Library
The pandas library is a powerful and flexible open-source data analysis and manipulation tool built on top of the Python programming language. It is widely used in data science, machine learning, and data analysis projects due to its ability to handle large datasets efficiently and its rich set of functionalities.
Table of Contents
Pandas Series
This is a one-dimensional array that can hold any type of data. This is just like a column in a table
Create Pandas Series with a List
import pandas as pd
data = ["netmiko", "scrapli", "nornir"]
variable = pd.Series(data)
In [1]: import pandas as pd
...: data = ["netmiko", "scrapli", "nornir"]
...: variable = pd.Series(data)
In [2]: variable
Out[2]:
0 netmiko
1 scrapli
2 nornir
dtype: objectThe index starts from 0 by default. To customize the index, you can do it this way:
In [5]: import pandas as pd
   ...: data = ["netmiko", "scrapli", "nornir"]
   ...: variable = pd.Series(data, index=["a", "b", "c"])

In [6]: variable
Out[6]:
a    netmiko
b    scrapli
c     nornir
dtype: object
Create Pandas Series with a Dictionary
As mentioned earlier, a Pandas Series can contain any kind of data type. Here is an example using a Python dictionary:
import pandas as pd

# Create a dictionary with network metrics and their counts
network_metrics = {
    'total_number_of_mac_addresses_count': 150,
    'total_number_of_route_count': 45,
    'lldp_neighbor_count': 10,
    'total_number_of_vlans_count': 20,
    'total_number_of_ports_count': 48
}

# Create a Pandas Series from the dictionary
metrics_series = pd.Series(network_metrics)

# Display the Series
print(metrics_series)
The index has become the key of the dictionary.
In [7]: import pandas as pd
   ...:
   ...: # Create a dictionary with network metrics and their counts
   ...: network_metrics = {
   ...:     'total_number_of_mac_addresses_count': 150,
   ...:     'total_number_of_route_count': 45,
   ...:     'lldp_neighbor_count': 10,
   ...:     'total_number_of_vlans_count': 20,
   ...:     'total_number_of_ports_count': 48
   ...: }
   ...:
   ...: # Create a Pandas Series from the dictionary
   ...: metrics_series = pd.Series(network_metrics)

In [8]: metrics_series
Out[8]:
total_number_of_mac_addresses_count    150
total_number_of_route_count             45
lldp_neighbor_count                     10
total_number_of_vlans_count             20
total_number_of_ports_count             48
dtype: int64
Filter Pandas Series
Let's create a series with only "lldp_neighbor_count" and "total_number_of_route_count". This is kind of a filtering inside of a Pandas Series
In [26]: metrics_series = pd.Series(network_metrics, index=["lldp_neighbor_count", "total_number_of_route_count"])

In [27]: metrics_series
Out[27]:
lldp_neighbor_count            10
total_number_of_route_count    45
dtype: int64
Now we only see these two values from the Series.
Pandas DataFrames
A Pandas DataFrame is a two-dimensional data structure, similar to a table with rows and columns or a two-dimensional array.
Here is a sample of my data:
network_metrics = {
    'mac_addresses_count': [150, 250, 145, 12],
    'route_count': [45, 34, 23, 56],
    'lldp_count': [10, 9, 8, 12],
    'vlans_count': [20, 21, 25, 34],
    'ports_count': [48, 36, 78, 2]
}
Create Pandas DataFrame with a Dictionary
Let's create a Pandas Dataframe and print this data:
In [35]: network_metrics = {
    ...:     'mac_addresses_count': [150, 250, 145, 12],
    ...:     'route_count': [45, 34, 23, 56],
    ...:     'lldp_count': [10, 9, 8, 12],
    ...:     'vlans_count': [20, 21, 25, 34],
    ...:     'ports_count': [48, 36, 78, 2]
    ...: }

In [36]: df = pd.DataFrame(network_metrics)

In [37]: df
Out[37]:
   mac_addresses_count  route_count  lldp_count  vlans_count  ports_count
0                  150           45          10           20           48
1                  250           34           9           21           36
2                  145           23           8           25           78
3                   12           56          12           34            2
Filter Pandas DataFrame witha single row
This can we done with "Locate Row" attribute very easily.
- If we want to return only single row:
In [51]: df
Out[51]:
   mac_addresses_count  route_count  lldp_count  vlans_count  ports_count
0                  150           45          10           20           48
1                  250           34           9           21           36
2                  145           23           8           25           78
3                   12           56          12           34            2

In [52]:

In [52]: df.loc[0]
Out[52]:
mac_addresses_count    150
route_count             45
lldp_count              10
vlans_count             20
ports_count             48
Name: 0, dtype: int64
In [54]: type(df.loc[0])
Out[54]: pandas.core.series.Series
Filter Pandas DataFrame witha multiple row
- To Return multiple rows
In [55]: df
Out[55]:
   mac_addresses_count  route_count  lldp_count  vlans_count  ports_count
0                  150           45          10           20           48
1                  250           34           9           21           36
2                  145           23           8           25           78
3                   12           56          12           34            2

df.loc[[0,2]]

mac_addresses_count  route_count  lldp_count  vlans_count  ports_count
0                  150           45          10           20           48
2                  145           23           8           25           78

In [57]: In [57]: type(df.loc[[0,2]])
Out[57]: pandas.core.frame.DataFrame
Customize DataFrame index Value
We can customize the index values while we craete the DataFrame:
import pandas as pd

network_metrics = {
    'mac_addresses_count': [150, 250, 145, 12],
    'route_count': [45, 34, 23, 56],
    'lldp_count': [10, 9, 8, 12],
    'vlans_count': [20, 21, 25, 34],
    'ports_count': [48, 36, 78, 2]
}

metrics_devices_df = pd.DataFrame(network_metrics, index = ["device1", "device2", "device3", "device4"])


In [60]: metrics_devices_df
Out[60]:
         mac_addresses_count  route_count  lldp_count  vlans_count  ports_count
device1                  150           45          10           20           48
device2                  250           34           9           21           36
device3                  145           23           8           25           78
device4                   12           56          12           34            2
To filter single device as Pandas Series:
In [61]: metrics_devices_df.loc["device1"]
Out[61]:
mac_addresses_count    150
route_count             45
lldp_count              10
vlans_count             20
ports_count             48
Name: device1, dtype: int64
to filter multiple devices as Pandas DataFrame:
In [62]: metrics_devices_df.loc[["device1", "device3"]]
Out[62]:
         mac_addresses_count  route_count  lldp_count  vlans_count  ports_count
device1                  150           45          10           20           48
device3                  145           23           8           25           78

In [63]:
Pandas File Operations
Reading CSV File
This is my sample CSV file and I will be crating a DataFrame from this file.
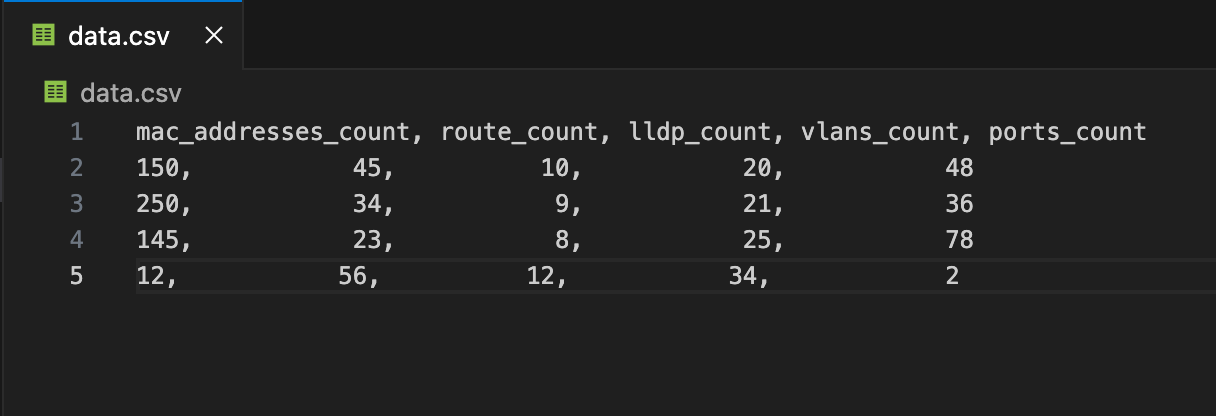
We use read_csv method.
In [1]: import pandas as pd

In [2]: df = pd.read_csv('data.csv')

In [3]: df
Out[3]:
   mac_addresses_count   route_count   lldp_count   vlans_count   ports_count
0                  150            45           10            20            48
1                  250            34            9            21            36
2                  145            23            8            25            78
3                   12            56           12            34             2

In [4]:

In [4]: df.to_string()
Out[4]: '   mac_addresses_count   route_count   lldp_count   vlans_count   ports_count\n0                  150            45           10            20            48\n1                  250            34            9            21            36\n2                  145            23            8            25            78\n3                   12            56           12            34             2'

In [5]:

In [5]:

In [5]: print(df.to_string())
   mac_addresses_count   route_count   lldp_count   vlans_count   ports_count
0                  150            45           10            20            48
1                  250            34            9            21            36
2                  145            23            8            25            78
3                   12            56           12            34             2

In [6]:
Reading JSON File
This is my sample JSON file and I will be crating a DataFrame from this file.
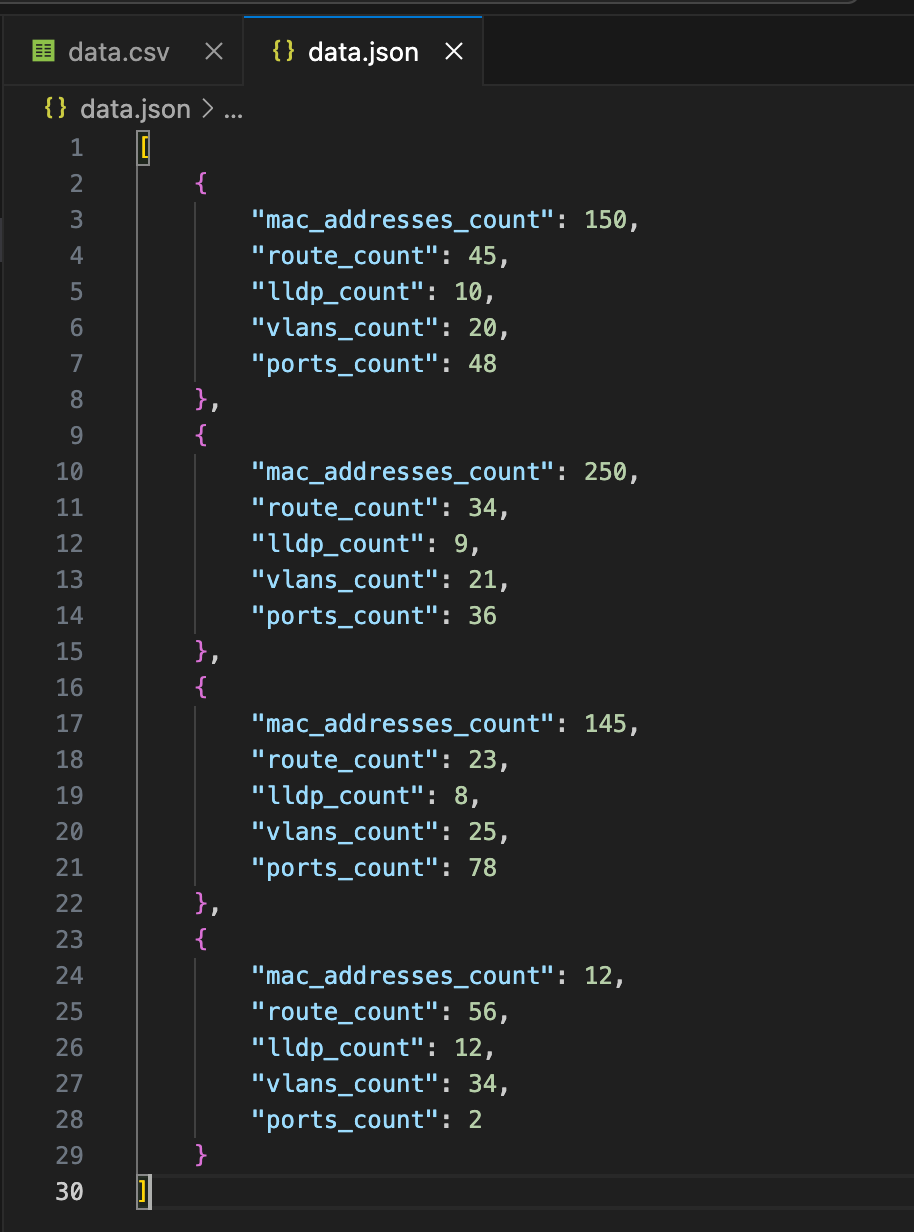
we use "read_json" method.
In [1]: import pandas as pd
   ...:
   ...: df = pd.read_json('data.json')

In [2]: df
Out[2]:
   mac_addresses_count  route_count  lldp_count  vlans_count  ports_count
0                  150           45          10           20           48
1                  250           34           9           21           36
2                  145           23           8           25           78
3                   12           56          12           34            2
info about the Dataframe:
In [5]: df.info()
<class 'pandas.core.frame.DataFrame'>
RangeIndex: 4 entries, 0 to 3
Data columns (total 5 columns):
 #   Column               Non-Null Count  Dtype
---  ------               --------------  -----
 0   mac_addresses_count  4 non-null      int64
 1   route_count          4 non-null      int64
 2   lldp_count           4 non-null      int64
 3   vlans_count          4 non-null      int64
 4   ports_count          4 non-null      int64
dtypes: int64(5)
memory usage: 292.0 bytes
Conclusion
In this blog page, I covered the basics of using Pandas for data manipulation. I started with an introduction to Pandas, followed by creating and filtering Pandas Series and DataFrames. I also explored customizing DataFrame indices and performing file operations such as reading CSV and JSON files. With these skills, we are now prepared to handle and analyze data efficiently using Pandas.